IMG-Friendly States for Residency (2026): Where IMGs Actually Match
April 10, 2026
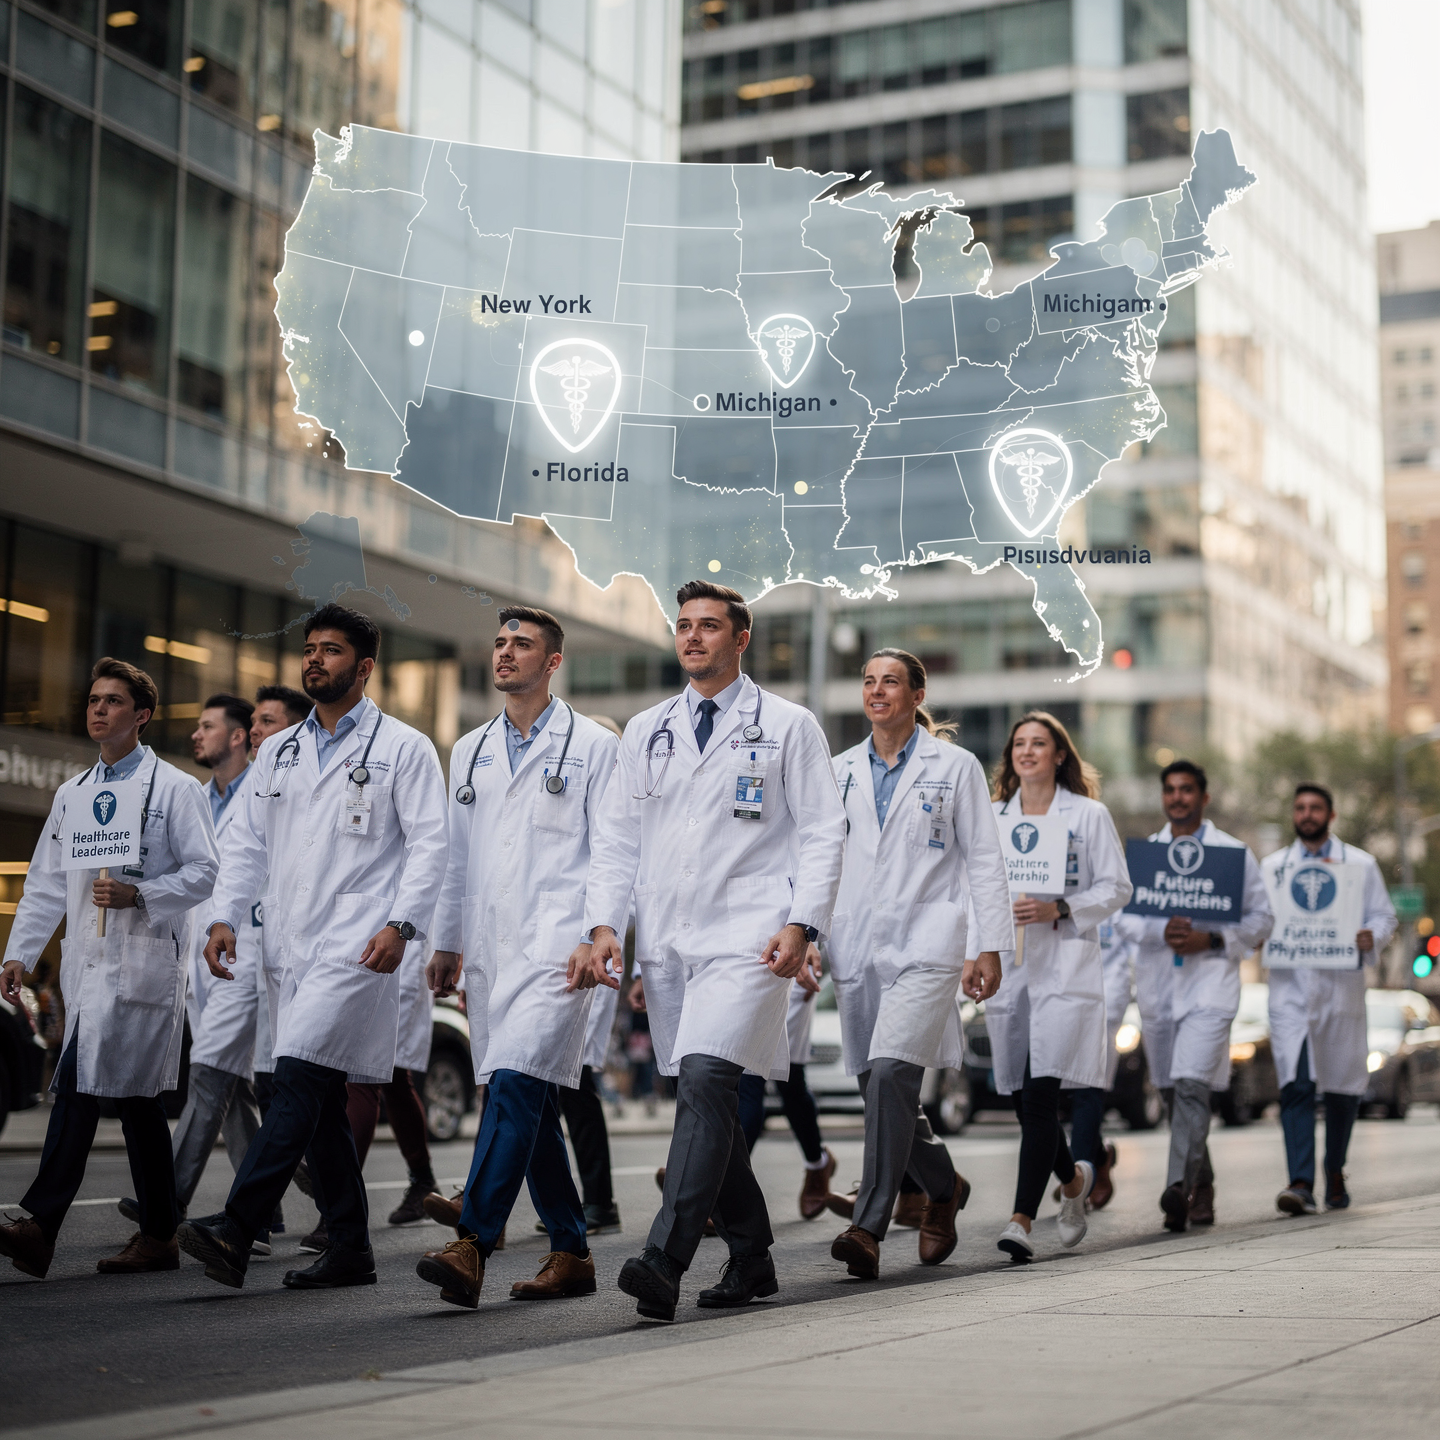
Top IMG-Friendly States for Residency in the USA (2026 Match)
If you are searching for IMG-friendly states for residency, you are trying to answer a critical question: where should you apply to maximize your chances of matching in the United States?
The concept of “IMG-friendly states” is useful—but incomplete. Residency programs do not select applicants based on geography. They select through structured processes—primarily selective screening followed by holistic review.
State-level data reflects where international medical graduates match, not how they are selected.
Because programs within the same state apply very different screening criteria, applying based on geography alone is often inefficient.
A more effective approach is to build a customized residency program list based on your profile, accounting for USMLE performance, visa status, year of graduation, and clinical experience.
The table below shows where IMGs matched in the highest absolute numbers in the 2026 Match, reflecting program density and training capacity across the United States.
Top 5 IMG-Friendly States
Based on the official 2026 NRMP Main Residency Match data, these states had the highest number of matched IMGs.
| Rank | State | US-IMG | Non-US IMG | Total |
|---|---|---|---|---|
| 1 | New York | 319 | 1,269 | 1,588 |
| 2 | Florida | 509 | 450 | 959 |
| 3 | Texas | 313 | 342 | 655 |
| 4 | Michigan | 219 | 358 | 577 |
| 5 | Pennsylvania | 199 | 341 | 540 |
| 6 | California | 288 | 231 | 519 |
| 7 | New Jersey | 291 | 210 | 501 |
| 8 | Ohio | 164 | 223 | 387 |
| 9 | Illinois | 168 | 195 | 363 |
| 10 | Connecticut | 95 | 166 | 261 |
Source: 2026 NRMP Main Residency Match
New York represents a clear outlier, followed by Florida as a distinct second-tier hub. The remaining states form a dense middle band driven primarily by program distribution rather than uniform accessibility. These patterns reinforce a critical point: state-level trends reflect where IMGs match—not how programs evaluate and select applicants.
Top IMG-Friendly Internal Medicine States in the 2026 Match
The chart below visualizes total IMG match volume by state alongside Internal Medicine concentration, which remains the dominant specialty pathway for international medical graduates.
A structured, data-driven view of IMG-friendly Internal Medicine states in the 2026 residency Match, highlighting where international medical graduates matched in the highest absolute numbers.
This summary integrates total IMG match volume, Internal Medicine concentration, and state-level structural patterns influencing IMG placement.
IMGPrep Analyst of NRMP Data 2026
Source: NRMP 2026 Main Residency Match
Absolute IMG Match Volume by State
New York
1,588 total IMGs | Internal Medicine: 786 47.0%
Florida
959 total IMGs | Internal Medicine: 450 50.9%
Texas
655 total IMGs | Internal Medicine: 315 37.7%
Michigan
577 total IMGs | Internal Medicine: 278 54.7%
Pennsylvania
540 total IMGs | Internal Medicine: 273 37.8%
California
519 total IMGs | Internal Medicine: 231 19.7%
New Jersey
501 total IMGs | Internal Medicine: 309 59.8%
Ohio
387 total IMGs | Internal Medicine: 187 36.4%
Illinois
363 total IMGs | Internal Medicine: 180 33.6%
Connecticut
261 total IMGs | Internal Medicine: 166 59.7%
Internal Medicine remains the dominant pathway for IMG residency placement across all states. Higher-volume states reflect program density and training capacity, not reduced selectivity.
Emergency Medicine and IMG Placement: Distribution and Strategy (2026)
While Internal Medicine remains the most common pathway for IMGs, other specialties—particularly Emergency Medicine—are evolving with increasing training capacity and new program development.
Unlike Internal Medicine, Emergency Medicine relies heavily on specialty-specific evaluation, particularly the Standardized Letter of Evaluation (SLOE), making clinical performance and U.S. rotations central to program selection.
Applicants interested in Emergency Medicine should approach program targeting differently, focusing on evaluation strength, departmental exposure, and specialty-specific alignment rather than application volume alone.
New York
US-IMG: 40% | Non-US IMG: 60%
Florida
US-IMG: 45% | Non-US IMG: 55%
Texas
US-IMG: 50% | Non-US IMG: 50%
Michigan
US-IMG: 55% | Non-US IMG: 45%
Pennsylvania
US-IMG: 48% | Non-US IMG: 52%
Emergency Medicine Selection Strategy
Emergency Medicine has expanded significantly, with 29 new Emergency Medicine residency programs developed over the past five years. While this increases opportunity, program selection remains highly structured and specialty-specific.
At the selective screening stage, programs heavily weight objective metrics—particularly Step 2 CK scores for Emergency Medicine.
During holistic review, the most important signal is clinical performance captured through the Standardized Letter of Evaluation (SLOE).
To understand how these factors interact—and how to identify programs where your application will be reviewed—see our complete Emergency Medicine IMG strategy guide.
Family Medicine IMG Distribution and Fill Rates (2026)
Family Medicine represents a secondary but important pathway for IMG residency placement, with broader geographic distribution compared to Internal Medicine. The table below shows state-level positions, IMG participation, and fill rates.
State-level distribution of Family Medicine positions, IMG participation, and fill rates based on NRMP 2026 data.
| State | FM Pos. | Filled | US-IMG | Non-US | IMG % | Fill | Ref |
|---|---|---|---|---|---|---|---|
| New York | 302 | 273 | 56 | 89 | 53.1% | 90.4% | NRMP |
| Florida | 280 | 246 | 51 | 50 | 41.1% | 87.9% | NRMP |
| Texas | 347 | 294 | 37 | 38 | 25.5% | 84.7% | NRMP |
| California | 634 | 557 | 81 | 75 | 28.0% | 87.9% | NRMP |
| Pennsylvania | 357 | 303 | 27 | 75 | 33.7% | 84.9% | NRMP |
| Michigan | 264 | 200 | 29 | 69 | 49.0% | 75.8% | NRMP |
| Arkansas | 96 | 71 | 16 | 28 | 62.0% | 74.0% | NRMP |
Family Medicine shows greater variability across states, with IMG participation influenced by regional program distribution and applicant preferences. Higher IMG percentages do not indicate reduced competitiveness but rather reflect program familiarity with international graduates.
Lower fill rates in some regions may indicate geographic imbalance or applicant preference trends rather than program quality or accessibility.
US-IMG vs Non-US IMG Distribution by State (2026 Match)
This graph shows how matched IMGs are distributed within each state between US-IMGs and non-US IMGs across all specialties in the 2026 NRMP Main Residency Match. Unlike raw IMG volume alone, this view helps distinguish states that are more heavily composed of non-US IMGs from those with a larger proportion of US-IMGs.
State-level composition of matched IMGs by applicant type across all specialties.
US-IMG
Non-US IMG
New York
US-IMG: 319 (20.1%) | Non-US IMG: 1,269 (79.9%)
Non-US dominant
Non-US dominant
Florida
US-IMG: 509 (53.1%) | Non-US IMG: 450 (46.9%)
US-IMG leaning
US-IMG leaning
Texas
US-IMG: 313 (47.8%) | Non-US IMG: 342 (52.2%)
Balanced, slight non-US tilt
Balanced, slight non-US tilt
Michigan
US-IMG: 219 (38.0%) | Non-US IMG: 358 (62.0%)
Non-US favorable
Non-US favorable
Pennsylvania
US-IMG: 199 (36.9%) | Non-US IMG: 341 (63.1%)
Non-US favorable
Non-US favorable
California
US-IMG: 288 (55.5%) | Non-US IMG: 231 (44.5%)
US-IMG leaning
US-IMG leaning
New Jersey
US-IMG: 291 (58.1%) | Non-US IMG: 210 (41.9%)
US-IMG leaning
US-IMG leaning
Ohio
US-IMG: 164 (42.4%) | Non-US IMG: 223 (57.6%)
Non-US favorable
Non-US favorable
Illinois
US-IMG: 168 (46.3%) | Non-US IMG: 195 (53.7%)
Balanced, slight non-US tilt
Balanced, slight non-US tilt
Connecticut
US-IMG: 95 (36.4%) | Non-US IMG: 166 (63.6%)
Non-US favorable
Non-US favorable
This distribution does not reflect match rates. Instead, it shows the composition of matched IMGs within each state across all specialties. States with a higher share of non-US IMGs may reflect stronger visa sponsorship patterns and more established international training pipelines, while US-IMG-leaning states may reflect different applicant pools and regional training dynamics.
Source: NRMP 2026 Main Residency Match
Frequently Asked Questions About IMG-Friendly States
What are the most IMG-friendly states for residency in 2026?
The states with the highest number of matched IMGs in 2026 include New York, Florida, Texas, Michigan, and Pennsylvania. These states have a high concentration of residency programs and established IMG training pipelines. However, match success depends on program-level criteria, not location alone.
Which states are best for Internal Medicine IMGs?
For Internal Medicine, states such as New Jersey, Connecticut, Michigan, Florida, and New York show high IMG representation. Some of these states have IMG percentages exceeding 50% within Internal Medicine programs, indicating consistent intake of international graduates.
Are some states better for non-US IMGs?
Yes. Non-US IMGs should prioritize states with strong J-1 visa sponsorship patterns and programs with a history of training international graduates. States like New York, Florida, and New Jersey tend to offer more opportunities, but eligibility still depends on program-specific screening criteria.
Does applying to IMG-friendly states increase my chances of matching?
Not necessarily. Applying to states alone does not increase match probability. Residency programs evaluate applicants based on USMLE scores, graduation year, visa requirements, and clinical experience. Match success depends on applying to programs where your application will pass selective screening.
Why do IMGs match more in certain states?
IMG match concentration is driven by higher numbers of residency programs, community-based hospital systems, and established IMG training pipelines. These factors increase the number of available positions but do not reduce competitiveness.
What is the biggest barrier for IMGs in the Match?
The primary barrier is obtaining interviews. Many applications are filtered out during selective screening based on objective criteria such as exam scores and visa requirements. Once an applicant reaches the interview stage, match rates increase significantly.
Are newer residency programs more IMG-friendly?
Newer programs may offer more flexibility as they build their resident cohorts. However, they still apply screening criteria, and success depends on alignment with program requirements rather than program age alone.
Should I only apply to IMG-heavy states?
No. Limiting applications based on geography can exclude viable programs. A more effective strategy is to identify programs across all states where your profile aligns with screening thresholds and historical IMG intake.
How can I identify programs that will actually review my application?
Applicants should evaluate programs based on visa policies, USMLE score expectations, graduation year cutoffs, and IMG representation. Understanding how residency programs use selective screening and holistic review is essential to identifying programs where an application will be considered.
Related Resources for IMG Applicants
State-level data is one input. Match outcomes are decided by program-level fit. The following resources cover the structural factors that determine where IMG applications get reviewed.
IMG-Friendly Residency Programs (2026)
Strategic guide to identifying programs that align with your profile, built on current NRMP and ACGME data.
Five-Year IMG Match Analysis (2022–2026)
What five years of NRMP data reveal about IMG Match strategy, stability, and goodness of fit.
Selective Screening and Holistic Review
How residency programs actually evaluate applications, and where IMG profiles get filtered or advance.
Customized Residency Programs List
A profile-based application list filtered by SUVY: Scores, U.S. Clinical Experience, Visa, and Year of Graduation.
Building Your IMG Residency Match Strategy
State-level data identifies where IMGs match in the highest absolute numbers, but program-level criteria determine which applications are actually reviewed. Visa sponsorship policies, year-of-graduation cutoffs, USMLE thresholds, and historical IMG recruitment patterns vary widely between programs in the same state.
IMGPrep has advised international medical graduates through the U.S. residency Match for over two decades.
Our advisory work is built on the SUVY framework—Scores, U.S. Clinical Experience, Visa, and Year of Graduation—and integrates Customized Residency Program Lists, ERAS Document Services, USCE rotations, and Interview Preparation into a unified strategy aligned to the programs most likely to review your application.
Contact Us
IMGPrep LLC, 4000 Legato Rd. Suite 1100
Fairfax, VA 22033
Fairfax, VA 22033
Fax: +1 (202) 751-2590